Y-drop Testing Shows Positive Impact in 2017 Yield

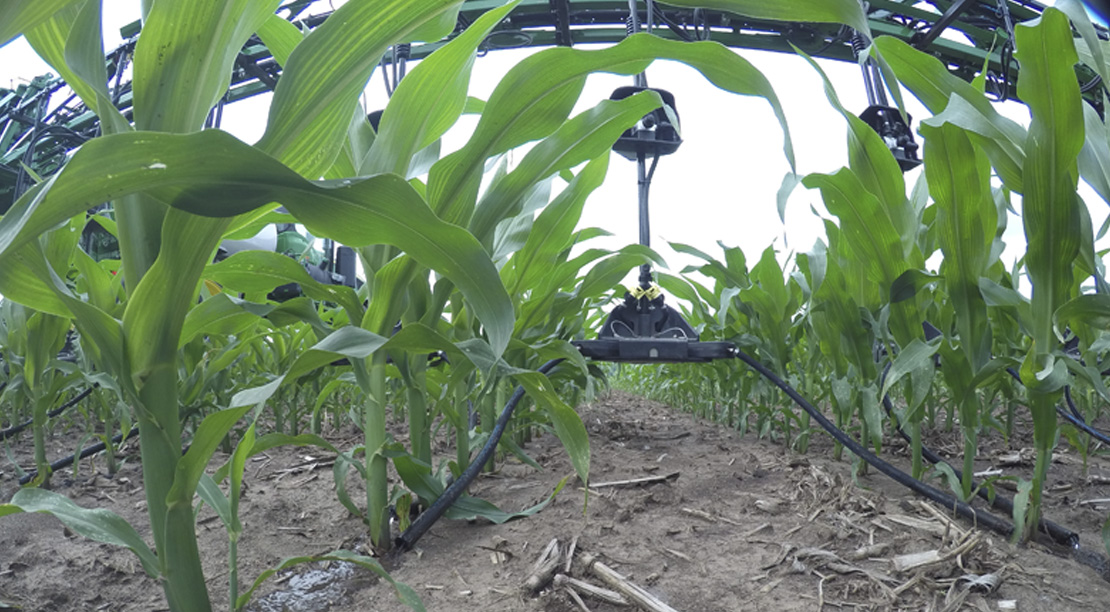
A few years ago, we started working on split-applying nitrogen during the growing season using the Y-drop system from 360 Yield Center. For a refresher on the Y-Drop system, check out this blog from 2015.
In 2016, we had a phenomenal year for growers in the Red River Valley. Growers received free nitrogen due to mineralization resulting in record yields for some. But, this also resulted in insignificant variation in our fertility trials (see below for results from two fields in 2016).
2017, being a much drier year, provided a little more variation in our fertility yield results. In 2016, our base fertility program consisted of 125 lbs of nitrogen. We decided that rate was too high for 2017 based off 2016 results so we went with a base rate of 90 lbs of nitrogen.
In 2016 our top yield was achieved using 20 gal of 28% UAN (60lbs N) and 30 gal (90lbs N) applied the first week of July. In 2017, our top yield was 30 gal applied around the same timeframe. For a deeper dive in 2016’s results, click here.
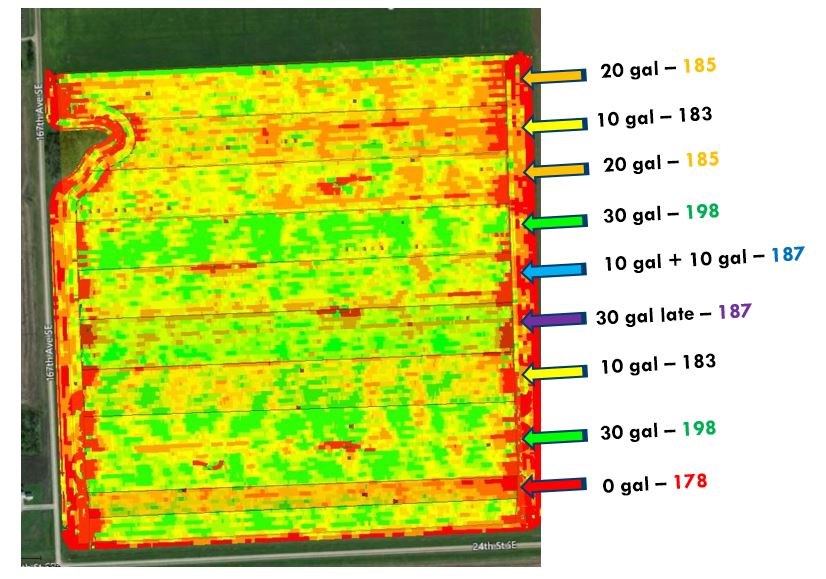
A good way to analyze how well your nitrogen program performed is to do this type of testing on your farm. An important part of the equation is to leave a 0 gal Y-Drop strip. For example: In 2016, the lowest yielding 0 Y-Drop was 200 bu/A. The highest yielding 20 gal Y-Drop yielded only 6 bu/A more at 206 bu/A.
In contrast, if you look at the data from 2017 and compare the lowest yielding 0 gal Y-Drop (178 bu/A) and the highest yielding 30 gal (198 bu/A) you see a difference of 20 bu/A! Yes, overall, the yields were lower than the records of 2016. But, what should be stressed is the larger difference between the lowest and highest due to program N management.
There is another key point we can we can determine from this data. The yield difference from 10 gal (183 bu/A) to 20 gal (185 bu/A) is not very significant. However, there is a jump from 20 gal (185 bu/A) to 30 gal (198 bu/A). While it’s important to remember that the conditions vary year to year and this is just a couple years of data, what this may show is that an average Y-Drop rate of 30 gallons with a base rate of 90 lbs of N may get us closer to raising our yields while being more efficient. A sort of ‘sweet spot’ if you will.
As I stated, our 2017 results also show a wider and range of yield throughout the different Y-Drop rates. On the rest of the Peterson Farms Seed, we utilized variable rate seeding along with variable rate Y-Drop applications with a range of 10-30 gal with a field average of around 20 gallons. This provided us with the ability to capitalize the higher-yielding parts of the field and to save input costs in the lower-yielding areas of the field.
For the 2018 season, we plan to replicate these Y-Drop test strips again to confirm our results. Also, we plan to do some testing with the base-rate application to determine our optimal rate. This way, we won’t take the risk of running the corn plant short by the time we apply the Y-Drop nitrogen later in the summer.
As always, feel free to contact me with any questions regarding the Y-Drop system from the 360 Yield Center. Our agronomy team has a lot of experience in farmers’ fields, and 360 Yield Center is a natural extension for them. 360 Yield Center’s products can add to a farm’s bottom line in the very first year of use, so they are a great fit for the current farm economy.


