It’s All About the Numbers. Trash or Treasure?
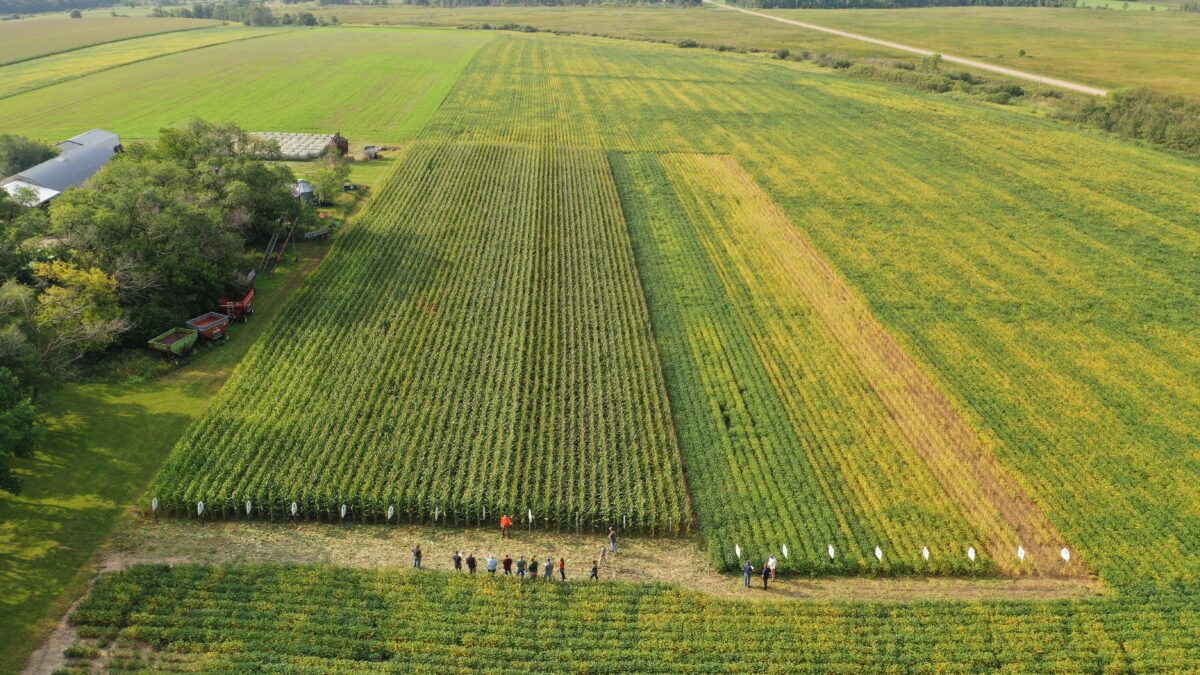
By now, you’ve probably heard us talk about our extensive replicated testing program. It isn’t just talk. In 2023, in addition to university testing, we had soybean tests at 39 locations and corn trials at 36 locations across ND, SD, and MN, – right in your own backyard!
By keeping our data local, we are keeping it relevant to you. We added even more locations for 2024, so keep an eye out for a few more ‘PFS Testing’ signs near you!
What is Replicated? Why Does it Matter?
All data are not created equal. I’ll speak about our soybean trials; corn testing is similar. ‘Tests’ are typically made up of 25 or 30 different varieties, or ‘entries,’ which are then replicated, or repeated, three times within that test. This test takes up about 1/10th of an acre. A ‘plot’ consists of one variety planted in 2 rows that are 15’ long. Again, within the test, a variety will be planted randomly three times in that 1/10th of an acre. We use research software that tells us where to place these three replications, so we do not end up with the same two varieties planted next to each other. A ‘location’ will contain several of these tests.
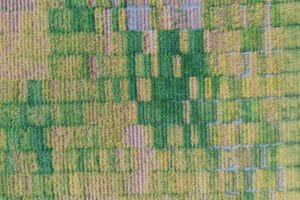
One-tenth of an acre is not a large area, so what makes this method of research better than others? We work hard to determine the best and most uniform land to plant our locations. In total, a location can be anywhere from 5 to 10 acres in size. In the fall or spring, the research team will spend a huge amount of time finding the best 10 acres to place our tests. We stay off headlands, avoid swales or hills, and find fields that are representative of the surrounding area. The areas we choose are a very uniform “garden spot.”
But, what if you have land that is very nice and uniform, but also farm a lot of variable soils, low ground, light or heavy soils? I’ll tackle that question shortly. We ask our cooperators to use the same farming practices that they normally use, since we don’t want them to give our plots special treatment! Between our testing locations and third-party companies, we cover a vast area. Each test is planted at 12-15 locations within a region every year. Grand Forks, ND is a good example. We usually have six locations on either side of the Red River to cover that region.
By the Numbers
As an example, having 15 locations with three replications each generates 45 data points per entry, per year. Think of it as 45 comparisons between 24XF01 and 23XF009 in a single year, plus 3-4 prior years’ worth of testing. That generates a ton of data! When I first started research work, computers were first coming out, so I did a lot of pencil and calculator work. Thank goodness that has changed. Now we enter everything into software that calculates the yields for all the plots quicker than I can sharpen an old wooden pencil. On top of that, computers can give us a deep statistical analysis of those yields. With so many data points in a single season, we can generate a very accurate data set.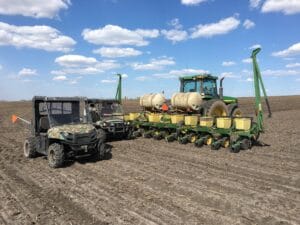
Going back to our example, our data tells us 24XF01 beat 23XF009 by 2.6 bushels in 2023. Then, our software analyzes the entire data set and tells us that if we see a difference of 2.0 bushels or greater, we can be 95% sure 24XF01s yield better than 23XF009s. That 2.0-bushel difference is .05 LSD (least significant difference). The .05 level gives us a 95% confidence level in our data and therefore, we can say with confidence that 24XF01s are a better-yielding variety. Our testing methods determine the true genetic difference in the yielding ability of what we are selling and what we might sell in future years.
The Other Guys
When other companies talk about their “research,” most of the time they are talking about strip trial plots. These are usually 4 rows planted anywhere from 100’ to 500’ deep. There might be 5-10 varieties and these varieties are potentially planted 2-3 times in a region. They are located close to a highway for good visibility and harvested with a weigh wagon, or even using a combine yield monitor to calculate yields. To be blunt, these trial numbers are meaningless. We’ve tried this test before, and you can do it next year in your own fields. Harvest 10 passes of the same variety and look at the yields separately. Those 10 passes will vary widely as far as yield. It is simply not an accurate way to compare varieties.
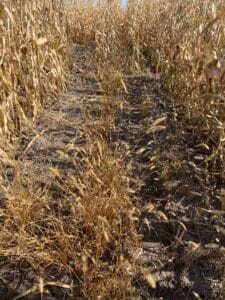
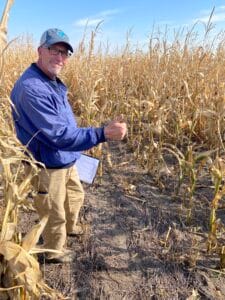
The above photos are a replicated plot our agronomy team checked out last year: see the missing rows and plants? This is the data that other companies are basing product decisions off of.
What about GO Plots?
“Wait, I’ve stood in front of Peterson Farms Seed’s plots that are strip trials!” We use our strip trials for teaching and observation, not for yield data collection. That’s why we call them GO (Grower Observation) plots. We plant these all over the countryside to observe how our varieties will react to variable soils and tough conditions. They are also a great way to teach our growers about our strong lineup.
In addition, we also utilize many types of disease plots. Whether it’s specialized IDC plots, inoculated Goss plots, or even using a helicopter to simulate green snap, this type of testing accurately delivers dependable data for Peterson Farms Seed and you to use.
Key Takeaways:
- Take pride and have confidence in the best testing program in the region by far! The consistent data out of our replicated program is leaps and bounds beyond many competitors, so you can sleep at night knowing you have perfect placement.
- Please utilize this data to help your growers match the right product for their operation. If you need assistance accessing the data, reach out to anyone on the team and we’ll get you to the right place!
- Use strip plots to help with placement, but final “data” should only be used anecdotally.
- With multiple years of high-quality regional data, we are confident that each product in our lineup has a purpose.
Rick’s Insights –Lead Agronomist Rick Swenson
 “I’ve been running plots and trial work since I started my career in 1997.
What Dennis and the research team are doing is the best that I’ve been a part of. Most of the time, when we talk about replicated data, I see eyes glaze over. But, the importance of using QUALITY data cannot be overstated.
Over half of my career has been spent in the seed industry. I’ve seen plenty of seed companies make terrible product development decisions that were based on poor data. Whether it is university data, private companies providing data or even computer-predicted data, multi-million dollar decisions are being made with poor data.
Peterson Farms Seed is different. Sweat equity and time make the difference. Being on the product team and helping make selections for the new lineup, I can 100% say that what we choose to bring forward is the best of the best. Our data is not poor data.
 So, whether it’s wheat, soybeans or corn, as we work through these winter months and focus on the lineup for years to come, having this tool at our disposal is why we keep providing quality products our customers can depend on. We do this all in your backyard to take out all the guesswork and uncertainty come decision-making time.”
